Average Fuel Economy Report
Provided byGeotab Inc.

Description
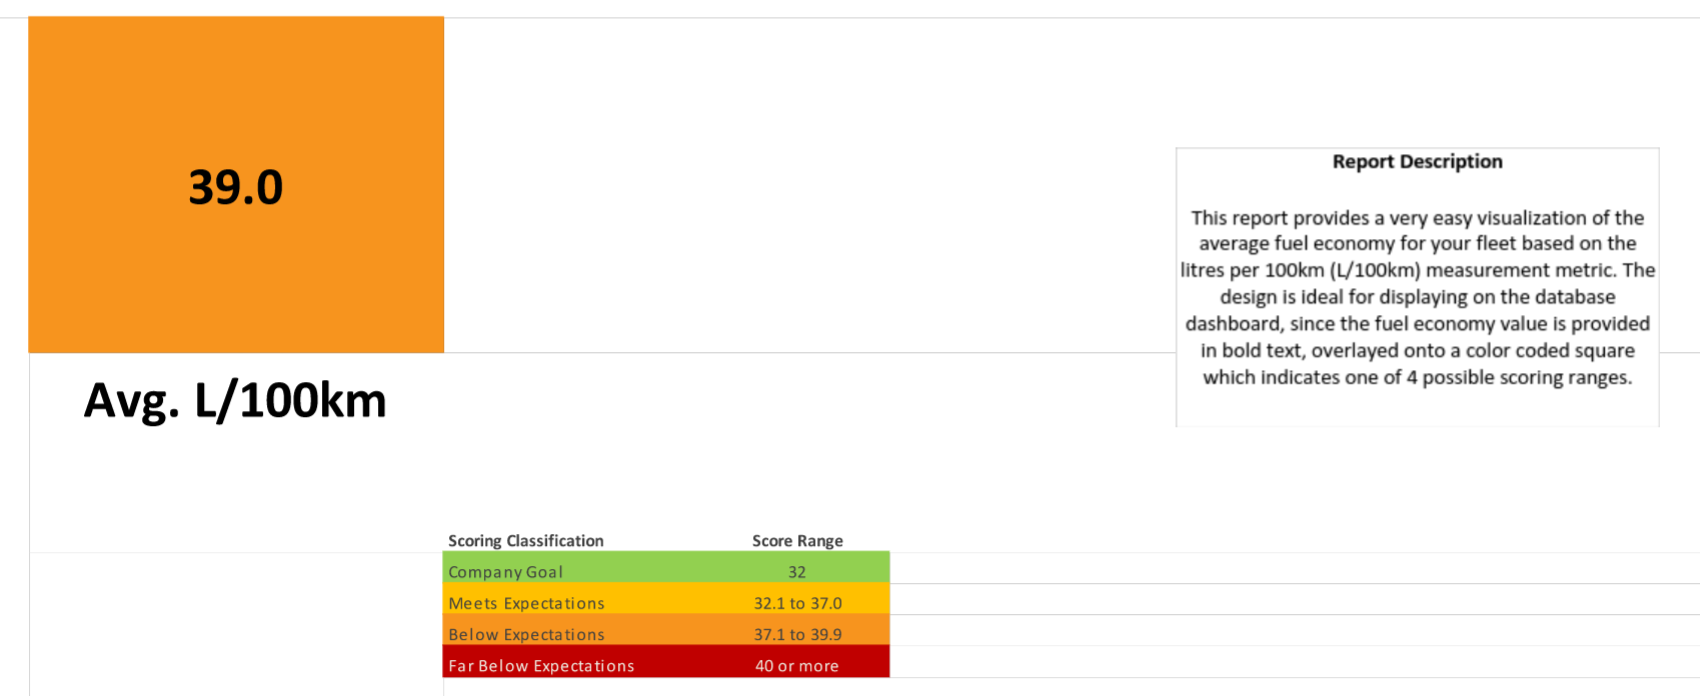
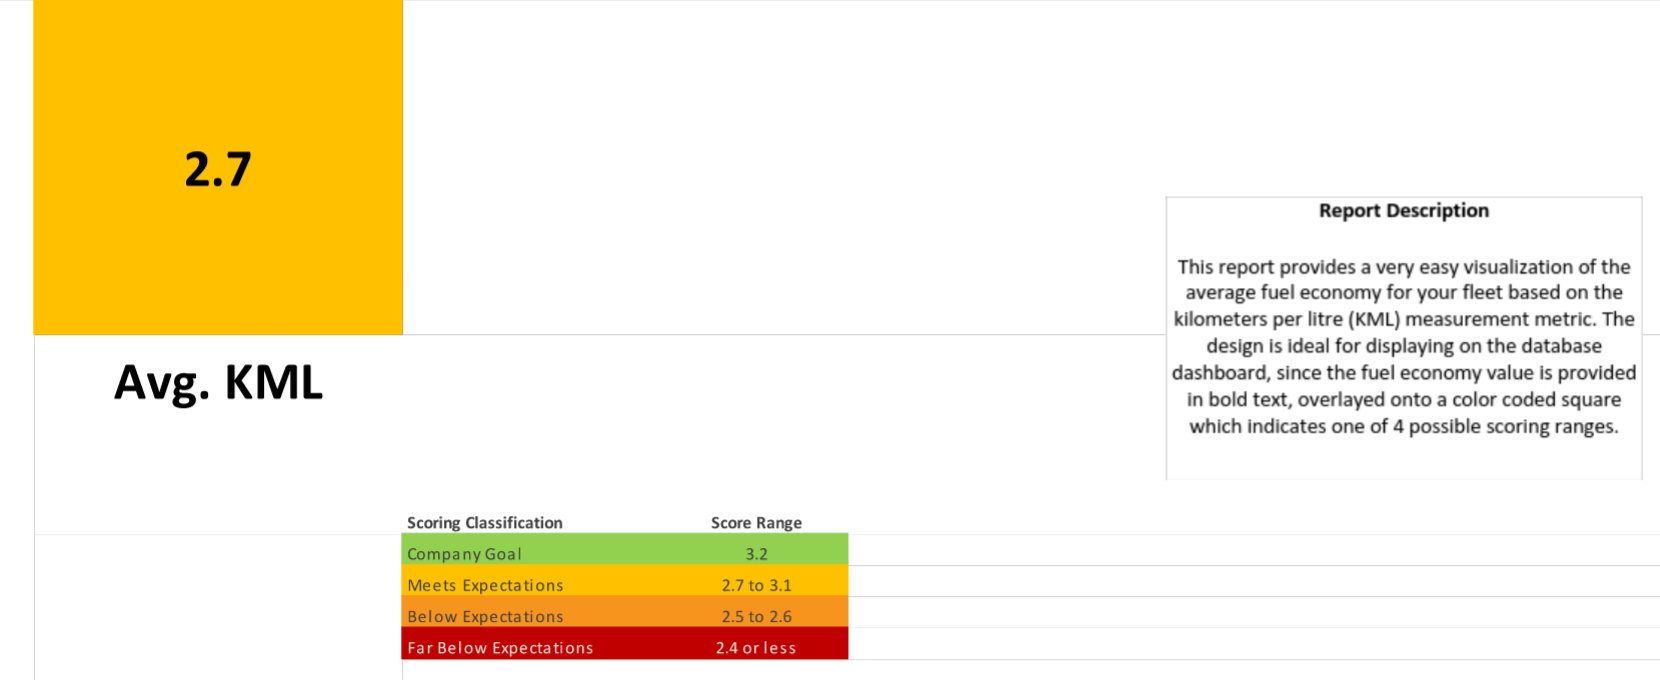
This report provides a very easy visualization of the average fuel economy for your fleet based on either:
- Litres per 100km (L/100km)
- MPG US
- MPG IMP
- KML
The design is ideal for displaying on the database dashboard, since the fuel economy value is provided in bold text, overlayed onto a color coded square which indicates one of 4 possible scoring ranges.
Features And Benefits
- Easy to interpret both the measurement metric value and score
- Great candidate for dashboard reporting
- Useful for fuel trending analysis over time
Instructions
To learn how to import a report into MyGeotab, view our Reporting Basics training found here.
After completing the file import, follow these steps:
- In the Report view tab, under Additional Report Options, select a desired grouping option for your data.
To configure this report as a Dashboard or Emailed Report, you will need to apply additional settings.
- Set the Report Date Range to your desired time range for assessing fleet KML.
- Similarly, specify a refresh period which will result in new data each cycle start.
- Select the group of vehicles you would like included in the report. By default, it is set to Everything as the user will only receive what they have access to.
- Select the group of users who should be able to view/receive this report. e.g. If this report is only meant for the Maintenance department, create a group a group called Maintenance Reports and assign the maintenance users to that group.
- Under Additional Report Options, you may choose to select a time period to group the overall data by.
Regions
Africa
Australia
Canada
Central & South America
Europe
Mexico
Middle East
UK
United States
Supported Languages
English
French
German
Spanish
Company Website
https://www.geotab.com/Top Industry Use Cases