
Login to leave a review

Geotab’s Collision Reconstruction Add-In allows you to view, analyze, and interpret collision data from Geotab tracking devices. It finds and analyzes known collisions for a given time period and displays all relevant information into a single, easy to read document.
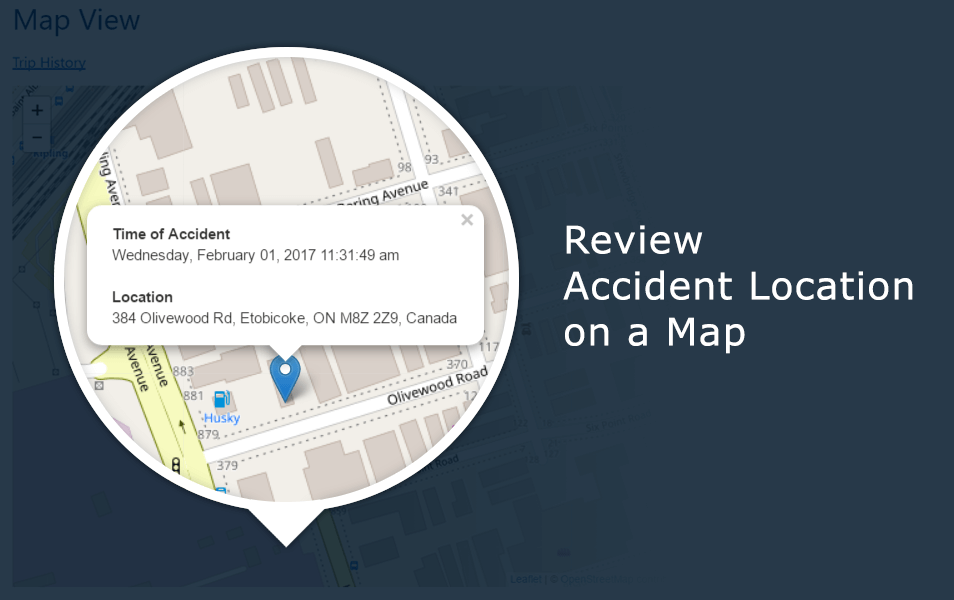
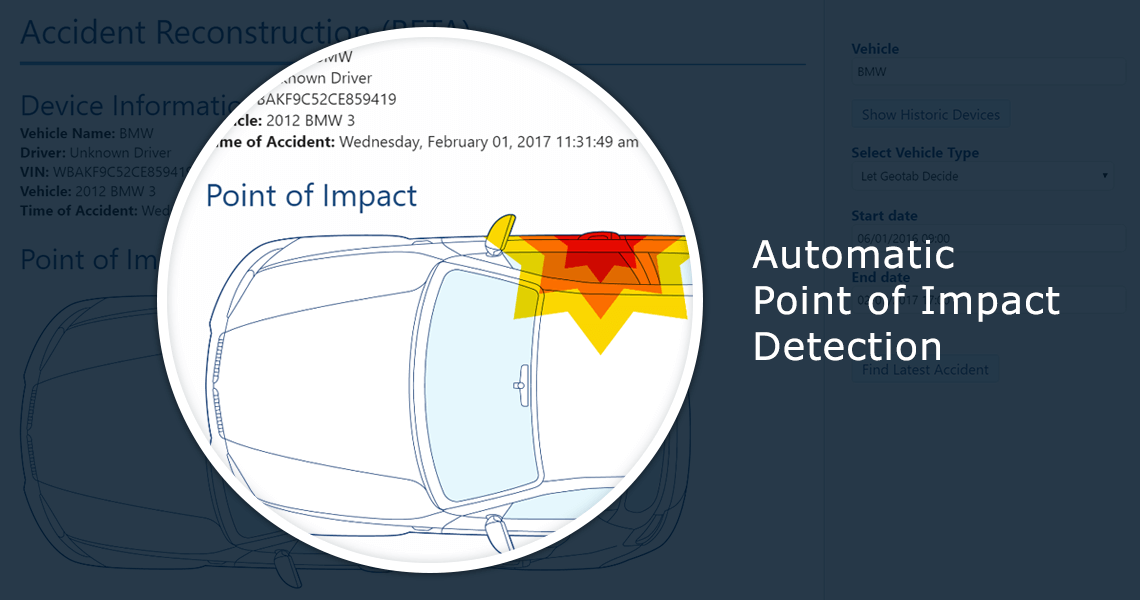
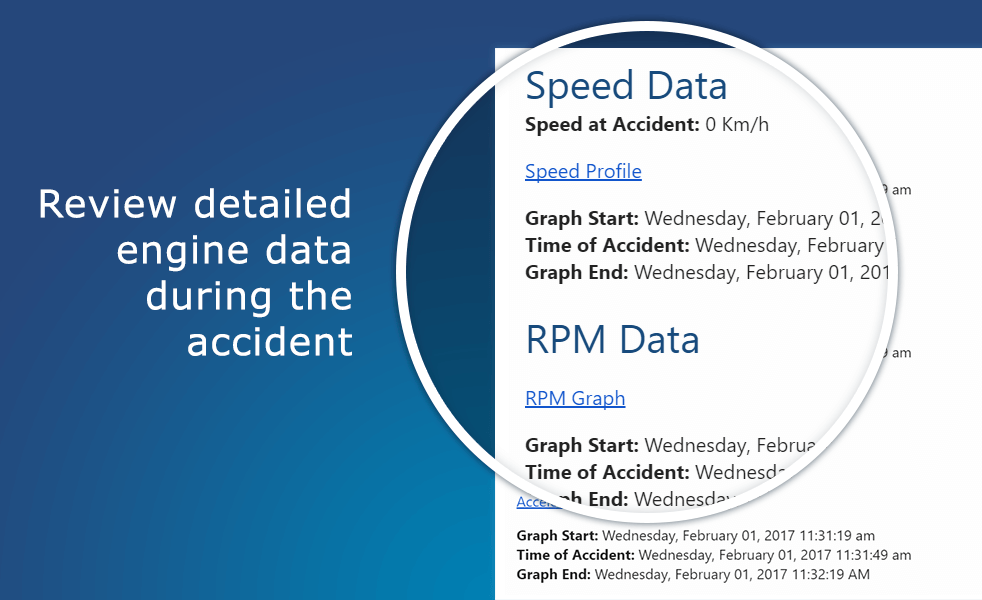
This tool is helpful for fleet managers and administrators to view the position and the point of impact of any collision in their fleet, and provides customized links to view the speed profile, RPM, and accelerometer data during the collision.
Features And Benefits
Features
- Reconstruction based on a larger time period
- All-in-one view of an accident without having to sort through and analyze separate sections of MyGeotab
- Point of Impact calculated based on the acceleration values received*
- Simple customized links to go straight into speed profile, RPM graph and accelerometer graph
Benefits
- Fast and easy to use solution for analyzing collision data
- Optimizing and simplifying complex accelerometer data
- Provides critical data to improve logistics and decision-making
- Point of impact can provide a better understanding of the overall accident as it occurred
- Increasing overall fleet safety by reducing potential recurring behavior in drivers
- Reduces potential accidents
Device Plan Requirements
GO, Pro, ProPlus
Company Website
https://www.geotab.com/Regions
Africa
Asia
Australia & New Zealand
Canada
Central & South America
Europe
Mexico
Middle East

UK
United States
Supported Languages

English
Login to leave a review
Free solution