
(0 reviews)
Login to leave a review
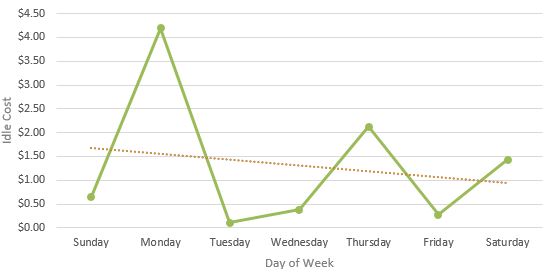
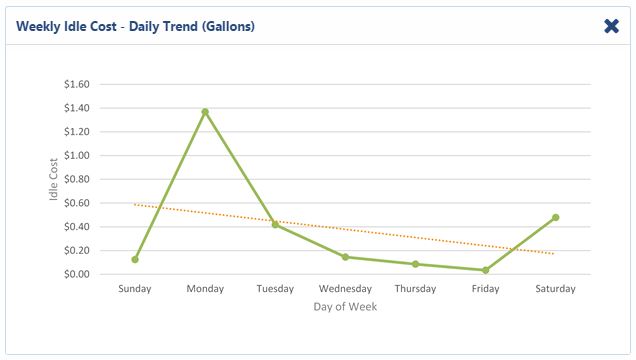
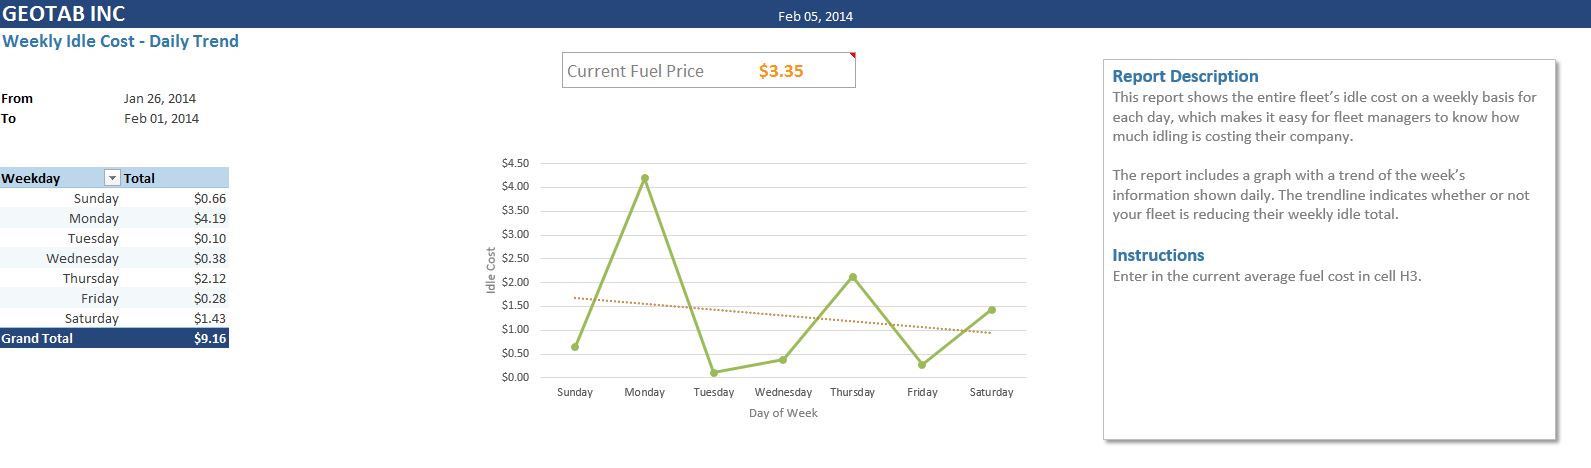

This weekly report displays the entire fleet’s idling costs for each day, making it easy for fleet managers to identify the total amount idling is costing their company.
The report calculates the cost based on the industry rule that states: on average, for every hour of idling, a vehicle will burn 1 gallon of fuel.
The data is displayed with a graph, which can be used to identify weekly trends. The trend line indicates whether or not your fleet is reducing their weekly idle total.
Features And Benefits
- Trended data to see how your fleet is performing
- Put an ROI to idle times to reduce costs and keep a healthier fleet
- Set the current fuel price to get a true cost of idling
Device Plan Requirements
Base, Pro, ProPlus
Company Website
https://www.geotab.com/Regions
Asia
Australia & New Zealand
Canada
United States
Supported Languages

English
(0 reviews)
Login to leave a review